
Factor Investing Part 1 - Market Factor
In 1960, Louis Engel, the head of marketing at the brokerage house Merrill Lynch, wanted to run an ad arguing explicitly that stocks were a good investment for ordinary people.
To their credit, the SEC informed Engel that in order to make such a claim he would need to be able to prove this argument before printing the ad.
Louis knew that he would need some help with this task. He called up his alma mater, the University of Chicago, to see if there was anyone there who was up to the task of doing this research. James Lorie, the associate dean of Chicago’s business school, raised his hand and agreed to take on the project. Robin Wigglesworth details the story in his book “Trillions”, and I have summarized it here.
Lorie and his team set out to calculate the average returns of common stocks listed on the New York Stock Exchange. The task including gathering historical data for over 1,700 stocks and 400,000 individual price quotations spanning he years between 1926 and 1960. The data needed significant sorting and scrubbing due to the multitude of different common stock, methods corporations distributed their profits to shareholders, and different tax treatments. The project was funded with a $50,000 grant from Merrill Lynch to the University of Chicago. Lorie and his team initially estimated that the project would take 1 year. It took over 4 years and an additional $150,000 by the time that the project was finally finished. The magnetic tape that their data set was compiled on would stretch 4.5km.
They had their answer. Someone investing money in all stocks on the New York Stock Exchange in 1926 and reinvested all of the dividends they received would have made 9 percent annually by 1960.
Thrilled by the result, Louis Engel and the team at Merrill Lynch printed a full page ad that ran in the Wall St. Journal. They announced the results at conferences and events in London, Geneva, and across the US from New York to San Francisco. It was an astonishing breakthrough - many investors who previously thought that bonds, with their steady income payments had higher returns than stocks in the long run.

Reprint of the "Rates of Return on Investments in Common Stocks" Wall Street Journal June 2, 1964
The project had a much more meaningful impact than the Wall Street Journal ad. It marked the beginning of a new research group at the University of Chicago called the Center for Research in Security Prices (CRSP). For the first time, academics and investment professionals could use data to test out how different investment approaches have worked historically, using that insight to inform how portfolios should be designed in the future. Investors no longer had to rely on gut instinct of a market forecaster or the luck of an investment manager any more. Rex Sinquefield, who was a student at Chicago at the time, noted in a joking manner, that “if I had to rank events, I would say CRSP is probably slightly more significant than the creation of the universe.”
So, now that we know that we can look at historical data to gain insights into the types of investments that do better or worse over long periods of time - what does that data tell us?
Before we jump there, let’s establish some basic terminology and some questions that we may want to have answered.
The research that Lorie performed to prove that stocks returned 9% per year is a finding in historical data, which we will refer to as an “empirical” finding. It was observed in historical data, it is not a theory or a guess. Next, we might question what are the unique characteristics of stocks that made them a better investment than, say, bonds? And, then, let’s extend that further and ask - what other characteristics or “factors” exist in publicly-traded securities that we can observe empirically? And then finally, how can we use that insight to construct portfolios for different investors with different needs, tastes, preferences, and goals?
Introducing Factors
Before we jump into the factors in detail, let’s establish what makes for a reliable factor. In his book “Your Complete Guide to Factor Based Investing”, Larry Swedroe gives us the following framework for how to establish whether a unique characteristic, or factor, observed in historical securities prices is worth pursuing in an investment portfolio. It needs to be:
- Persistent - it holds across long periods of time and in different economic seasons
- Pervasive - it holds across different countries, regions, and sectors
- Robust - it holds for various definitions (for example, the value factor - which we will dig into in Part 3 of this series- exists regardless of whether you measure it based on share price relative to book value, earnings, or company cash flow)
- Investable - it holds up not just on paper, but also after considering actual implementation issues, such as trading costs
- Intuitive - there are logical risk-based or behavioural based explanations for its premium and why it should exist
While there are literally hundreds of factors that have been identified by academics empirically, there are only a small handful that meet these criteria and are ones that we can confidently invest in. What about the rest of them? Some have faded away over time, some have been the result of data mining or random outcomes. My favourite example of data-mining is your friend or co-worker that wins the NCAA basketball pool by picking only teams with red uniforms. That approach works great “in sample”, meaning that it worked in their situation, but it falls apart when applied over long periods of time. We are left with 5 that we will explore in this series, and they are:
- Market Factor
- Size Factor
- Value Factor
- Term Factor
- Credit Factor
Introducing the Market Factor
Building on the work of Harry Markowitz, William Sharpe generally gets most of the credit for introducing the first formal asset pricing model. He developed his Capital Asset Pricing Model (CAPM) around the same time that Jim Lorie was completing his work at the University of Chicago.
CAPM was the first model to provide a definition for risk and how it drives returns. The model simply and elegantly describes the risk and return of a portfolio based on its exposure to the market, also known as market “beta”. The market “beta” is the measure of sensitivity of the equity risk of a stock, mutual fund or portfolio relative to the risk of the overall market.
For example, if Coca Cola’s shares rise by 0.8 percentage points for every 1 percent the broader US stock market rises, it has a beta of 0.8. If Google stock rises by 1.5 percentage points for every 1 percent the US stock market as a whole rises, it has a beta of 1.5. High-beta stocks are more volatile (meaning they move up and down) than low-beta stocks, therefore they should offer greater returns than steadier, lower-beta stocks.
Using an example in a diversified portfolio - meaning a portfolio with hundreds or even thousands of securities - let’s say Investor A has a portfolio that is 100 percent invested in high-beta technology stocks. The beta of Investor A’s portfolio is 1.5. If the US market as a whole goes up 10%, we expect Investor A’s portfolio to go up by 15% (10% * 1.5). If the market drops by 10%, we expect Investor A’s portfolio to drop by 15%.
Investor B owns a portfolio that is more conservative, like the Coca Cola stocks, utilities stocks, supermarket stocks, etc). The beta of this portfolio is only 0.8%, so if the market rose by 10%, we would expect Investor B’s portfolio to go up by 8%. If the market dropped by 10%, we would expect Investor B’s portfolio to go down by 8%.
Market Factor In the Data
Now we will examine the “premium” - or the excess return - that investors experienced by being exposed to the market factor over and above a risk free asset. In this case, we will use one-month treasury bills as our proxy for the risk-free asset. How has the market factor performed empirically?
All charts and data are from Dimensional Fund Advisors.
In Canada, the market factor has outperformed t-bills in 63% of 1 year periods, 73% of five year periods, and 89% of 10-year periods since 1973
1 Year Market Factor Premiums - Canada

Market Factor Outperformance Over Different Time Periods - Canada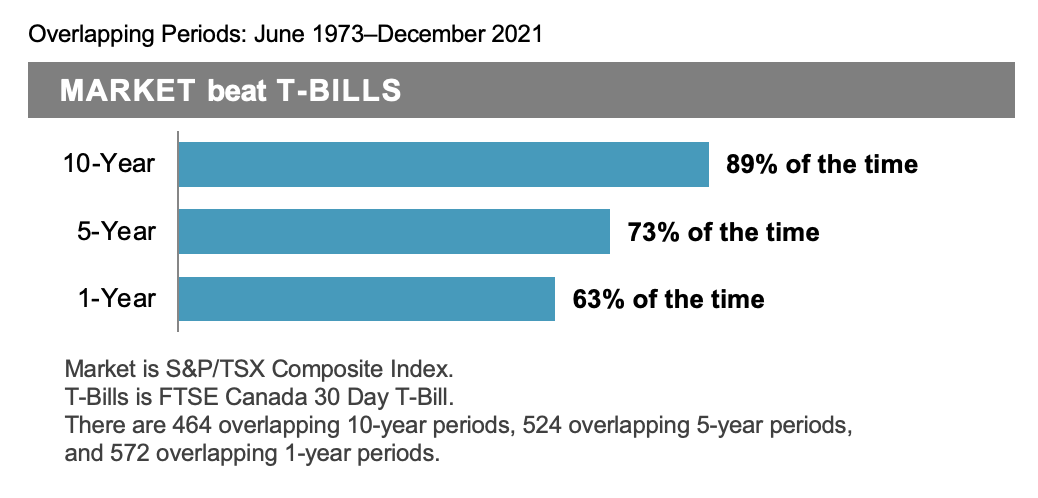
In the US, the market factor has outperformed t-bills in 70% of 1-year periods, 79% of 5-year periods, and 86% of 10-year periods since 1926.
1 Year Market Factor Premiums - US
Market Factor Outperformance Over Different Time Periods - US

Internationally (ex-US), the market factor has outperformed t-bills in 63% of 1-year periods, 71% of 5-year periods, and 94% of 10-year periods since 1926.
1 Year Market Factor Premiums - ex-US
Market Factor Outperformance Over Different Time Periods - ex-US Thoughts on the Market Factor
The market factor is clearly observed to have positive returns in the historical data in Canada, the US, and internationally. It passes the "tests" of being persistent and pervasive. It is also easily investible. Any investor can purchase a broad market ETF that holds the majority of publicly-available stocks in Canada, the US, and Internationally for a very low cost.
But is it intuitive? Is there a risk-based or behavioural based reason that the market factor should have positive premiums? Certainly, yes.
The risk of owning equities, or market beta, is significantly higher than owning one-month treasury bills. The risk of owning stocks is also highly related - or "correlated"- to the risks of the economic cycle. Investors who work for a living may lose their employment during a downturn in the economy, which may coincide with a drop in equities' values. In this case, an investor may be forced to sell at the worst possible time. Retirees who are relying on their portfolios for income may prefer to hold at least some portion of their portfolio in risk free assets like treasury bills to avoid being forced sellers in an extended bear market. Therefore, investors will demand a significant premium for owning equities vs. owning one-month treasuries - they are significantly more risky in the short run.
This risk can be observed in the data as well. The volatility measured by standard deviation for US Stocks from 1926 through to today is 18.35, compared with 0.87 for one-month treasury bills. 
Chart Source: DFA Returns Web
Conclusions
If you have read this far, congratulations! This subject can certainly be dry stuff. Not as exciting as listening to stories about star mutual fund managers and market forecasters. But, the understanding of stock and bond market history, and academics' conclusions about what it means for how we should invest, can make a big positive impact on how you manage your long term investments.
Make sure to check back in if you'd like to follow along with my series on Factor Investing. Or, you can subscribe to my weekly video newsletter here:
Thanks for reading!
--
The comments contained herein are a general discussion of certain issues intended as general information only and should not be relied upon as tax or legal advice. Please obtain independent professional advice, in the context of your particular circumstances. This article was written, designed and produced by Mark Walhout, CFP®, an Investment Funds Advisor with Investia Financial Services Inc., and does not necessarily reflect the opinion of Investia Financial Services Inc.The information contained in this article comes from sources we believe reliable, but we cannot guarantee its accuracy or reliability. The opinions expressed are based on an analysis and interpretation dating from the date of publication and are subject to change without notice. Furthermore, they do not constitute an offer or solicitation to buy or sell any securities.
Mutual Funds are offered through Investia Financial Services Inc. Commissions, trailing commissions, management fees and expenses all may be associated with mutual fund investments. Please read the prospectus before investing. Mutual funds are not guaranteed, their values change frequently, and past performance may not be repeated.